Risk & Volatility Control
All Think 2 Retire investment models use our Risk Management Indicators to control model volatility. However, this example of Risk and volatility Control is illustrated using our AIA Sector Rotation Model.
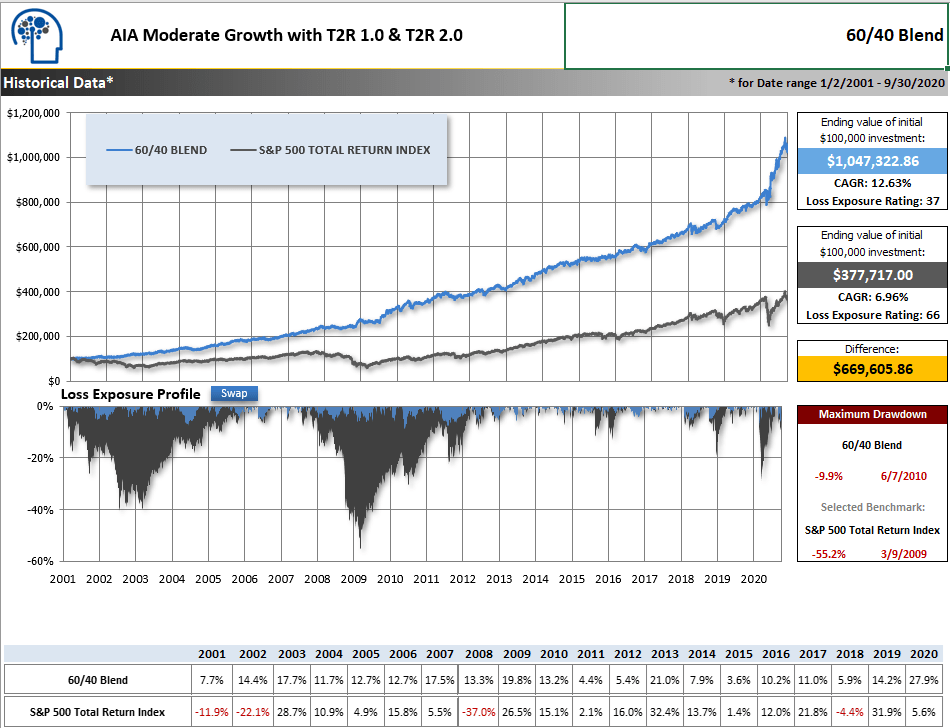
The adjacent graph compares the performance of the AIA Moderate Growth Portfolio (blue line) to the S&P 500 stock index (gray line). This portfolio consists of a maximum of 60% equities (AIA) and 40% bonds/cash, as described in "The Process" section.
By looking at the graph, you can observe that the AIA Moderate Growth Portfolio successfully avoids significant market declines experienced by the S&P 500 during the DotCom Bust of 2001-2002, Mortgage Meltdown of 2008-2009, and COVID Crash of 2020.
As a subscriber, you can use all Think 2 Retire investment models according to your preferences and investment goals.
The graph clearly shows that AIA and our Risk Management Indicators effectively control risk and improve long-term returns by avoiding most market downturns and capturing a significant portion of market upswings.
While the Think 2 Retire models aren't perfect or guaranteed solutions. As you can see, basing investment decisions on data and math instead of emotions offers clear advantages.
If you examine the Loss Exposure Profile below the graph, you'll notice that the AIA models exhibit lower long-term volatility than the S&P 500 Index. This provides more confidence during unstable economic periods and helps retain the majority of previous gains.
The Maximum Drawdown box (highlighted in red) allows you to compare the largest decline experienced by both AIA and the S&P 500 during the displayed time period. This provides a reference point for understanding AIA's control of volatility compared to historical stock market fluctuations.
Please note that the Think 2 Retire newsletter is exclusive to its members, who must undergo a live demo before activating their membership. Subscribers are not permitted to forward, share, or redistribute the newsletters and alerts to non-subscribers. Think 2 Retire is designed to assist individual non-professional investors and does not cater to financial advisors.
Notes & Disclaimer: The investments used in the adjacent graphs comprise exchange-traded funds representing stock market sectors. Your individual returns will vary depending on the exchange-traded funds and/or mutual funds available to you within your 401(k), IRA, and mutual fund family. The returns shown result from making trades on the same day the newsletter or alert is posted. The returns shown are from January 2, 2001, to September 30, 2020. Stock market indices, like the S&P 500 Index, are unmanaged groups of securities considered to be representative of the stock market in general or subsets of the market, and their performance is not reflective of the performance of any specific investment. Investments cannot be made directly into an index. Historical returns data are calculated using data provided by sources deemed to be reliable, but no representation or warranty, expressed or implied, is made as to their accuracy, completeness or correctness. This information is provided "AS IS" without any warranty of any kind. All historical returns data should be considered hypothetical. Past performance is no guarantee of future results.
60 Day Free Trial Subscription
Take Think 2 Retire on a free test drive.
You will see the value of having an Adaptive Investment Allocation (AIA) methodology.
After 60 days if you are not convinced of Think 2 Retire ’s value, you may simply “unsubscribe”. No hard feelings. During your trial subscription you’ll be treated as an active subscriber.
After completing a live Demo you’ll be entitled to:
- Current and past Think 2 Retire newsletter issues
- Current asset allocation suggestions
- Market updates and commentary
- Video library designed to help you understand and implement Think 2 Retire and AIA
- Ongoing live webinars
- All archived webinars

