Risk Management Indicators

Home   /   About   /   Risk Management Indicators

Risk Management Indicators

The Think 2 Retire risk management indicators overlay all model portfolios. We believe riding the market up just to ride it back down makes no sense. The risk management indicators are designed to spot trends early in their development and provide subscribers with the information needed to protect their money during times of market distress.

Think 2 Retire uses two risk management techniques: T2R 1.0 and T2R 2.0.

T2R 1.0 focuses on the mid to long-term market direction, providing guidance on overall market trends. T2R 2.0, on the other hand, focuses on the short-term market direction. These indicators work together to provide comprehensive risk management.

T2R 1.0 helps determine the general market direction and trend, while T2R 2.0 helps minimize the impact of short-term declines that can occur within positive long-term trends.

Check out the Adaptive Investment Allocation (AIA) video in our library to learn more about AIA and its risk management techniques.

Both indicators, T2R 1.0 and T2R 2.0 are crucial in allocation recommendations.

For Think 2 Retire to suggest maximum equity exposure, both indicators must be positive, indicating favorable market conditions.

However, if either indicator turns negative, indicating unfavorable market conditions, an Alert will be sent to all subscribers, advising them to reallocate to minimum market exposure.

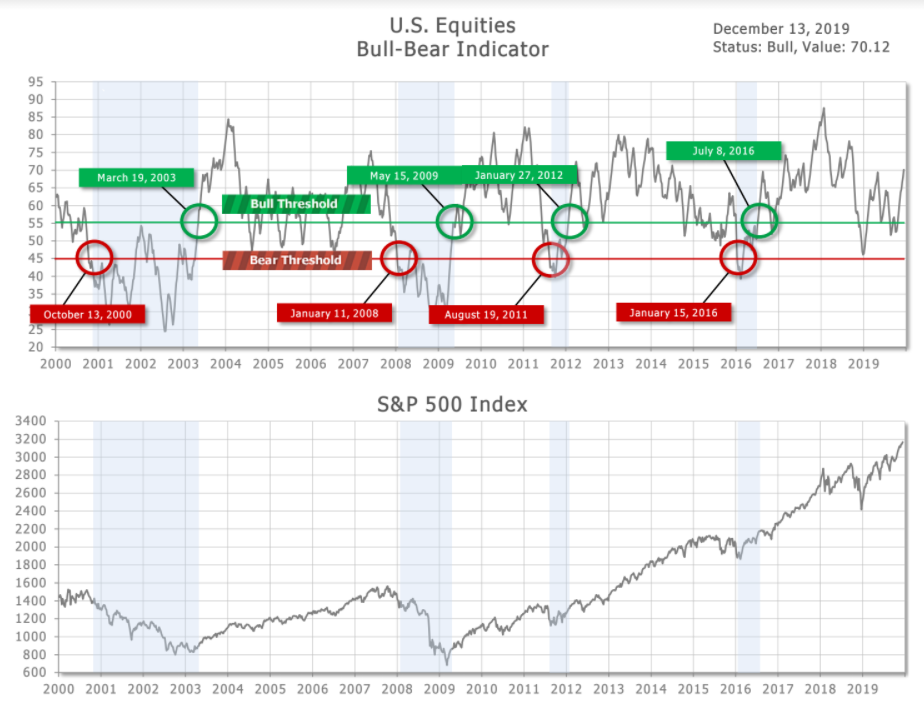
The primary tool used to identify market trends is the T2R 1.0 Indicator. It helps determine whether a new Bull Market (rising) or Bear Market (falling) has emerged. Our approach is based on factual data and mathematical analysis rather than predictions or theories.

Our risk indicators are by no means perfect. However, their track record of reducing volatility and producing solid long-term growth speaks for itself.

The T2R 2.0 indicator serves as an early warning system, alerting subscribers to potential market distress. When market data indicates a risk of further decline, the T2R 2.0 indicator will issue an Alert recommending a shift from stock and equity investments to more conservative bond or cash investments.

Using both the T2R 1.0 and T2R 2.0 indicators together can help reduce risk and enhance long-term performance.

It's important to note that both indicators must be positive for Think 2 Retire to suggest holding stock market positions. If either indicator turns negative, an Alert advising subscribers to reallocate from stocks to bonds or cash will be emailed.

Refer to the charts and graphs below and watch the videos in our video library for more information.

The Think 2 Retire newsletter is private and only available to its members through monthly or annual subscriptions. All subscribers must go through a live demo before membership activation. Subscriptions may not forward, share, or redistribute monthly newsletters and/or Alerts to non-subscribers. Think 2 Retire is intended to aid individual, non-professional investors. Therefore, No Financial Advisors, please.

T2R 1.0 Indicator

Click To Enlarge Image

T2R 2.0 Indicator

This example of risk management indicators uses our AIA sector rotation model.

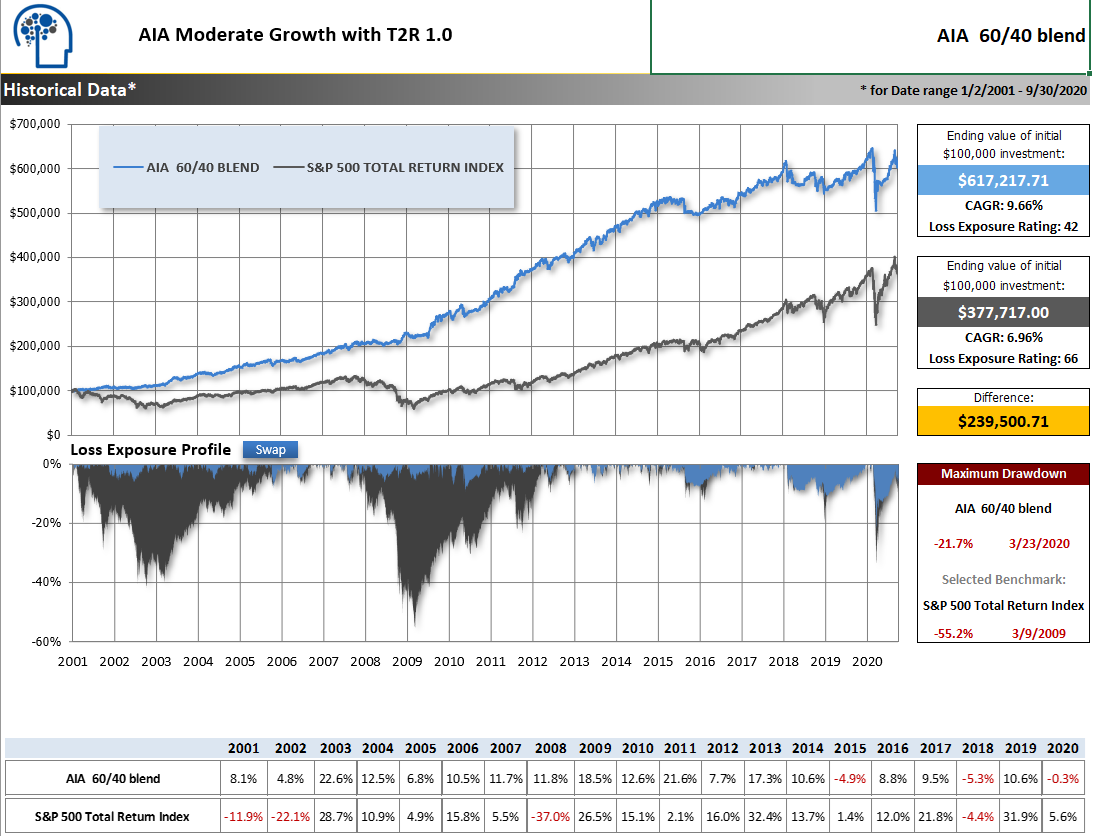
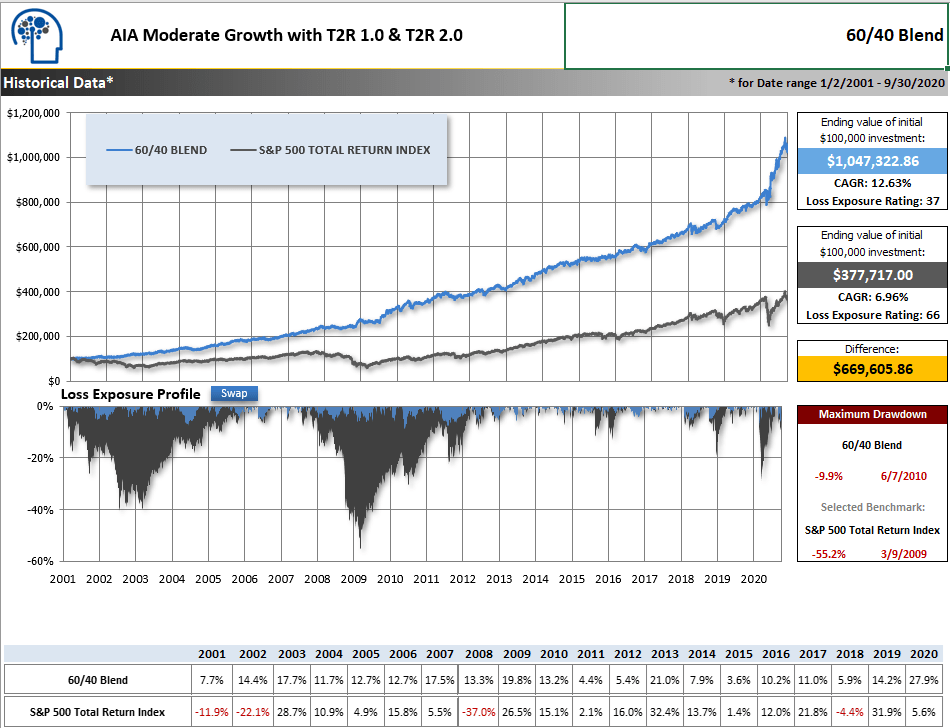
Let's examine two graphs to understand the value of using the T2R 1.0 and T2R 2.0 Risk Management indicators. The top graph compares AIA using only T2R 1.0 with the S&P 500 Total Return Index. The bottom graph shows AIA using both T2R 1.0 and T2R 2.0 together.

Both graphs use a moderate AIA allocation, with 60% AIA and 40% bonds.

In the top graph, using T2R 1.0 alone reduces volatility and increases long-term growth, as shown in the Loss Exposure Profile and Maximum Drawdown.

However, the results improve further when T2R 2.0 is applied alongside T2R 1.0 in the bottom graph. T2R 2.0 helps reduce volatility even more, leading to enhanced long-term growth.

For more details, watch the Adaptive Investment Allocation (AIA) video in our video library or request a demo.

Notes & Disclaimer: The investments used in the adjacent graphs comprise exchange-traded funds representing stock market sectors. Your individual returns will vary depending on the exchange-traded funds and/or mutual funds available to you within your 401(k), IRA, and mutual fund family. The returns shown result from making trades on the same day the newsletter or alert is posted. The returns shown are from January 2, 2001, to September 30, 2020. Stock market indices, like the S&P 500 Index, are unmanaged groups of securities considered to be representative of the stock market in general or subsets of the market, and their performance is not reflective of the performance of any specific investment. Investments cannot be made directly into an index. Historical returns data are calculated using data provided by sources deemed to be reliable, but no representation or warranty, expressed or implied, is made as to their accuracy, completeness or correctness. This information is provided "AS IS" without any warranty of any kind. All historical returns data should be considered hypothetical. Past performance is no guarantee of future results. By using anything on or related to our website, we assume you have done so and acknowledge those terms.

Legal Terms & Conditions


Click To Enlarge Image

60 Day Free Trial Subscription

Take Think 2 Retire on a free test drive.

You will see the value of having an Adaptive Investment Allocation (AIA) methodology.

After 60 days if you are not convinced of Think 2 Retire ’s value, you may simply “unsubscribe”.  No hard feelings. During your trial subscription you’ll be treated as an active subscriber.

After completing a live Demo you’ll be entitled to:

  • Current and past Think 2 Retire newsletter issues
  • Current asset allocation suggestions
  • Market updates and commentary
  • Video library designed to help you understand and implement Think 2 Retire and AIA
  • Ongoing live webinars
  • All archived webinars